An explainable artificial intelligence model to forecast Covid-19
for Ho Chi Minh City
Cuong Nguyen(1, ), Minh Nguyen(1), Duc Nguyen(1), Duc Nguyen(2), Thinh Nguyen(1), Khuong Nguyen(1), Chon Trung(1), and Tho Quan(1)
(1) University of Technology - Viet Nam National University Ho Chi Minh City
(2) Hanoi University of Science and Technology
(1) {cuong.nguyen1605, minh.nguyenhuynh.2257, duc.nguyenquang, ntthinh, nakhuong, ltchon, qttho}@hcmut.edu.vn
(2) duc.nq204876@sis.hust.edu.vn
October 27th, 2021
ABSTRACT
Viet Nam has succeeded in controlling the first three waves of the Covid-19 epidemic. However, with the appearance of the Delta variant, the pandemic is happening very complicatedly in Ho Chi Minh City. This project tries to contribute a part to the city's epidemic prevention by using a short-term prediction model of the disease's situation, thereby helping policymakers make accurate and timely strategies.
The method mentioned in this project is a Compartment model whose parameters are solved by Deep Learning techniques. By this method, the result not only achieves good accuracy but also can be explained.1. Introduction
Since the first case was identified in Wuhan, China in December 2019 due to a new novel virus, called SARS-Cov-2, it has been spreading rapidly to many countries around the world, which caused an ongoing global pandemic (Covid-19 pandemic). According to the figures of WHO on October 1st, 2021, there have been more than 245 million confirmed cases of Covid-19, including 4.9 million deaths, which made it one of the most severe and deadliest pandemics in history. Vietnam and especially Ho Chi Minh city have experienced more than one year in disease prevention and achieved certain successes. Nevertheless, with the appearance of the Delta variant spreading two to three times faster than others, the ongoing fourth wave of Covid-19 in Vietnam is longer and much more serious than previous ones. Concretely in Ho Chi Minh city, the pandemic situation is very complicated with more than 400,000 confirmed cases and 16,500 deaths, affecting all aspects of the economy and society more and more.
In the context of an infectious disease outbreak, predicting the pandemic is necessary and important to plan effective strategies. Hence in 2020, we developed a global pandemic prediction model based on the SIRD epidemic model and deep neural network, named BeCaked [1]. Technically, we can divide BeCaked into two groups consisting of a compartmental model in epidemiology and a deep learning model. The compartmental models simulate how the individuals in different compartments in a population interact, so it can explain an individual’s behavior in spreading and controlling the Covid-19 pandemic. However, this model has parameters, so we need to estimate that it can describe the results fitting with the actual data. Besides, the epidemic situation may change over time, the parameters change respectively, the projection from huge data becomes a non-trivial task. To overcome this drawback, we propose to use Deep Learning as an automatic way to learn the parameters. Deep Learning, is one of the hottest topics in Computer Science, has been applied in many fields and showed its abilities to learn from huge data very well. So we combine the advantages of Deep Learning with the SIRD model to create BaCaked. As our model was developed in 2020, it did not consider vaccination or lockdown compartments. It also shows a quite good prediction of the number of patients infected with Covid-19 in the period before the vaccination is approved by many countries all over the world and its effectiveness is acknowledged by many research in preventing severe disease as well as reducing the spread of the pandemic.
Because of the urgent situation in Ho Chi Minh city when the outbreak of Covid-19 is so rapid, inheriting from the above BeCaked model and being provided with the actual Covid-19 data of Ho Chi Minh city from the end of May 2021, we have thrived and extended BeCaked to build a new model for Ho Chi Minh city, which takes into account many new factors such as lockdown, vaccination. The initial results of our new model are relatively promising with the MAE and MAPE metrics compared to the actual data.
2. Method
We know that long-term forecasting is much more useful than short-term forecasting, but long-term forecasting is a difficult problem with cumulative errors. Furthermore, many policies have been issued frequently in Ho Chi Minh City, this makes the error of the long-term forecasting model even larger. Therefore, we decided to develop a short-term forecasting model to simplify the problem and get more reasonable results. As mentioned in the section Introduction, our method includes two main components: a compartmental model and a deep learning model.
2.1 Compartmental model
We develop and extend the SIR model [8] to create a more complex model, named SEIRDLVC, better describes the evolution of the epidemic in Ho Chi Minh city. Each individual in the population is assigned to only one of eight compartments with S (susceptible), E (exposed), I (infected), R (recovered), D (deceased), L (locked), V (vaccinated), C (critical). As a multi-compartment epidemic model, there must exist specific relations between compartments, which is depicted as Figure 1.
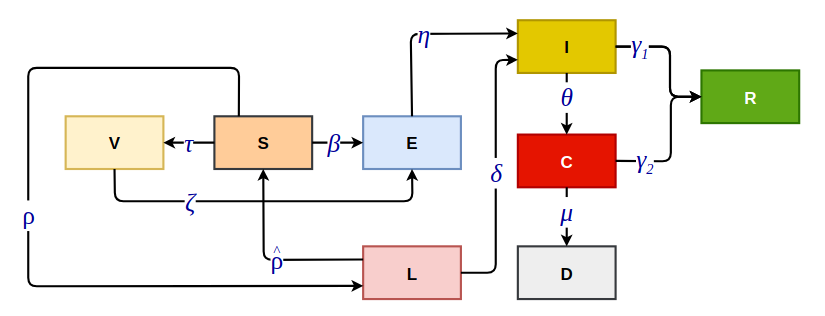
Figure 1: The relations between compartments
Our model consists of eight following compartments:
- S (susceptible): susceptible individuals are not currently infected with the disease yet and those who have not gotten vaccinated
- E (exposed): infectious individuals are not detected
- I (infected): currently infected cases
- R (recovered): the people have had the disease and are healthy now
- D (deceased): individuals have died due to Covid-19
- L (locked): individuals are living in restriction areas
- V (vaccinated): susceptible individuals are not currently infected with the disease yet and those who have gotten vaccinated
- C (critical): currently seriously infected cases
Initially, almost all the people are in \(S\) state, other people are in \(E\) state and the others are in the \(I\) state. The susceptible population \(S\), upon interactions with the exposed population \(E\), becomes exposed with the effective contact rate \(\beta\). Besides, each susceptible individual has a rate \(\tau\) to be gotten vaccinated and then is in \(V\) state. Simultaneously, the probability that a susceptible person lives in a restricted area is \(\rho\) and the one moves to \(L\) state. Conversely, the probability the restricted area becomes normal is . The vaccinated population \(V\) having interactions with the exposed \(E\) becomes exposed with the rate \(\zeta\). We assume that \(\zeta\) is less than \(\beta\) due to the efficiency of the vaccine. If \(\zeta\) equals zero, the vaccine offers immunizable protection against the disease. The probabilities that the exposed and locked population are confirmed to have Covid-19 are \(\eta\) and \(\delta\), respectively. Each currently infected case \(I\) has a rate \(\theta\) of becoming serious \(C\). The recovery of an infected person and a critical case are determined by the rates \(\gamma_1\) and \(\gamma_2\), respectively. The critical population \(C\) has a death rate \(\mu\) and then moves to \(D\) state.
2.2 Deep Learning model
An overview of our proposed method is shown in Figure 2. Generally, our model includes four components, namely Input, Encoder, Decoder, Output. The pipeline is detailed as follows:
- Firstly, the input data is forwarded to the encoder to produce the parameters of the SEIRDLVC model.
- Secondly, the decoder receives the output of the previous step and the input data to produce the prediction results.
- Finally, Mean Squared Error (MSE) is the loss function used to train the entire model. Because our method is an end-to-end model, it has advantages for the optimization process.
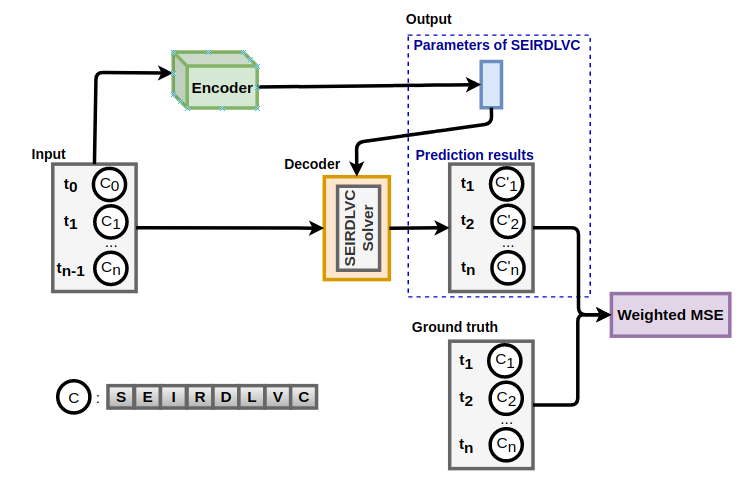
Figure 2: The overall structure of our approach
3. Result and Analysis
3.1 Result
The model is applied to Ho Chi Minh city’s Covid-19 data with daily reports of Ho Chi Minh Centers for Disease Control and Prevention (HCDC). Performances are measured with Mean Absolute Error (MAE) and Mean Absolute Percentage Error (MAPE). Detailed data for the evaluation strategy is described in Table 1, and Table 2 contains the performance values for our experiments. Table 2 shows that our experiments assess three indicators, namely infections, severe cases and deaths, and all are daily new reports. Our method is better than ARIMA on all indicators. Intuitively, as shown in Figure 3 and Figure 4, the predictions are close to the observed data in the interval from July 14th to September 23rd. So the initial results of our method are relatively promising, we are continuing to develop and improve further.Table 1: Summary of training set and test set
| Preiod | Rate (%) | |
|---|---|---|
| Training set | May 27th, 2021 - September 7th, 2021 | \(83.37\) |
| Test set | September 8th, 2021 - September 23th, 2021 | \(16.13\) |
Table 2: Performances of two methods for daily data
| Method | Metric | \(I\) | \(C\) | \(D\) |
|---|---|---|---|---|
| Our proposed method | MAE | \(1305.1516\) | \(46.0305\) | \(16.1948\) |
| MAPE | \(0.4918\) | \(0.7341\) | \(0.0836\) | |
| ARIMA | MAE | \(1736.9333\) | \(46.5333\) | \(93.3333\) |
| MAPE | \(0.6533\) | \(1.8104\) | \(0.5238\) |
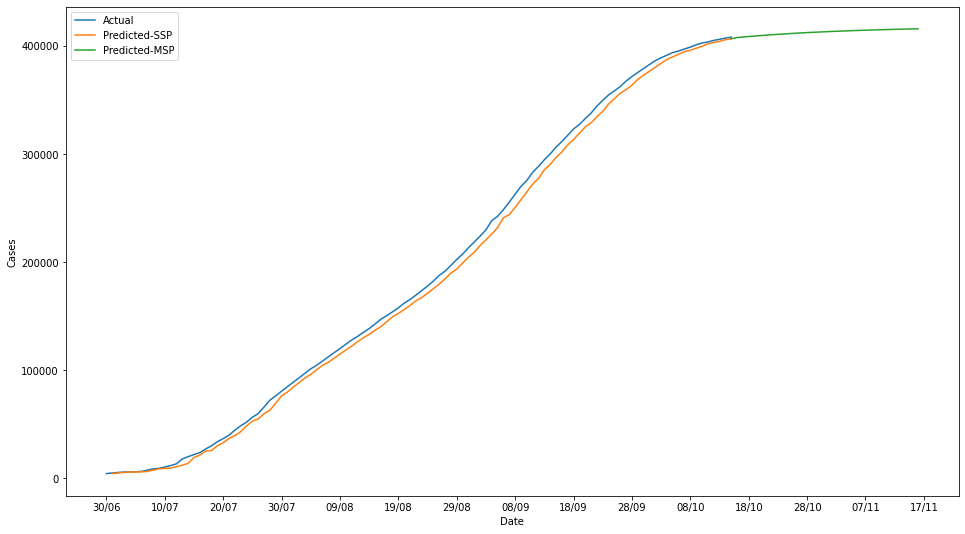
Figure 3: Prediction of daily infections
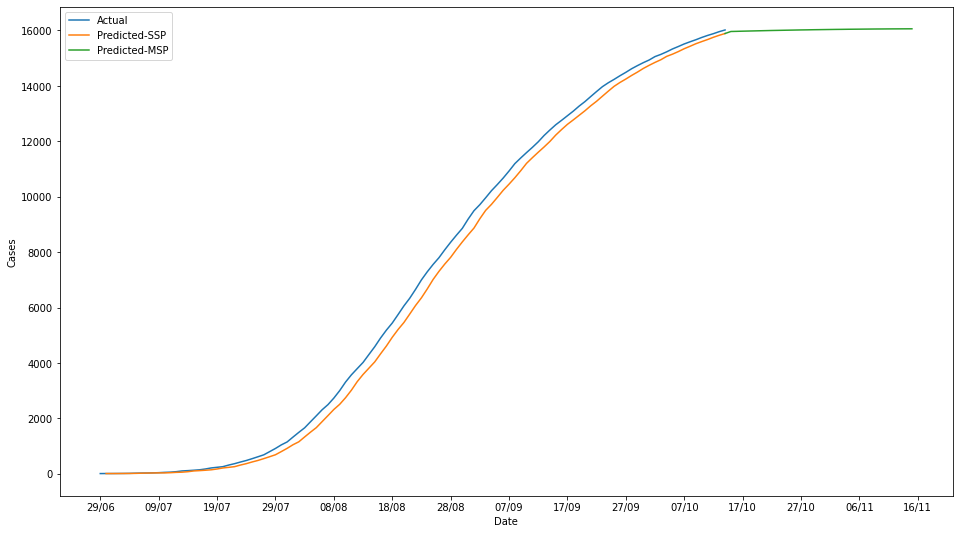
Figure 4: Prediction of total deceased
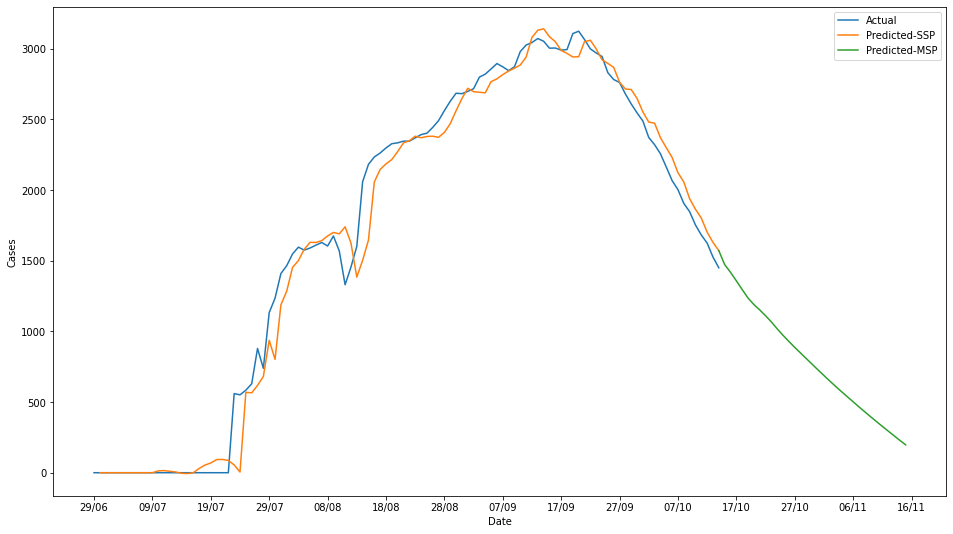
Figure 5: Prediction of total critical
3.2 Analysis of explainability of our model
As previously mentioned, our model can serve not only as a regression system with good fit curves for compartments of epidemic model (i.e Infected, Exposed, etc.), but also as a analytical system to generate the parameters of the epidemic model (i.e \(\beta,\zeta,\mu\), etc.) with an explanation of the regressed value at the same time.
More details, our encoder can infer the relationship between the sequence of compartments in the last 10 days and the parameters of the epidemic model, then the decoder is a differential equations solver that takes the compartments in the past and these parameters as the input to return the values of the compartments in next day.
References
[1] Nguyen, D., Vo, N., Nguyen, T., Nguyen, K., Nguyen, Q., Tran, D., & Quan, T. (2021). BeCaked: An Explainable Artificial Intelligence Model For COVID-19 Forecasting.
[2] Sesti, N., Garau-Luis, J. J., Crawley, E., & Cameron, B. (2021). Integrating LSTMs and GNNs for COVID-19 Forecasting.
[3] Carpenter, M., Luo, C., & Wang, X. (2021). The effects of regularisation on RNN models for time series forecasting: Covid-19 as an example.
[4] Jin, X., Wang, Y. X., & Yan, X. (2021). Inter-Series Attention Model for COVID-19 Forecasting. In Proceedings of the 2021 SIAM International Conference on Data Mining (SDM) (pp. 495-503). Society for Industrial and Applied Mathematics.
[5] Bertozzi, A. L., Franco, E., Mohler, G., Short, M. B., & Sledge, D. (2020). The challenges of modeling and forecasting the spread of COVID-19. Proceedings of the National Academy of Sciences, 117(29), 16732-16738.
[6] Moein, S., Nickaeen, N., Roointan, A., Borhani, N., Heidary, Z., Javanmard, S. H., ... & Gheisari, Y. (2021). Inefficiency of SIR models in forecasting COVID-19 epidemic: a case study of Isfahan. Scientific Reports, 11(1), 1-9.
[7] Chatterjee, S., Sarkar, A., Chatterjee, S., Karmakar, M., & Paul, R. (2021). Studying the progress of COVID-19 outbreak in India using SIRD model. Indian Journal of Physics, 95(9), 1941-1957.
[8] Harko, T., Lobo, F. S., & Mak, M. K. (2014). Exact analytical solutions of the Susceptible-Infected-Recovered (SIR) epidemic model and of the SIR model with equal death and birth rates. Applied Mathematics and Computation, 236, 184-194.
[9] Ioannidis, J. P., Cripps, S., & Tanner, M. A. (2020). Forecasting for COVID-19 has failed. International journal of forecasting.
[10] Kaur, J., Chattopadhyay, P., Singh, L., Chattopadhyay, K., & Mishra, N. (2021). Machine Learning Based Prediction and Impact Analysis of Various Lockdown Stages of COVID-19 Outbreak–A Case Study of India. Journal of Graphic Era University, 121-136.
[11] Ngo, H. A., Nguyen, T.-K., Nguyen, T.-A. (2021, October). A novel compartment model for analyzing and predicting Covid-19 outbreaks in Vietnam. Oral presentation at the 52nd Union World Conference on Lung Health.